


Abnormal AI stops the cyberattacks that legacy tools miss. If your company still treats AI like a pilot program, you’re in the wrong place. AI-powered engineering is our default, and we’re hiring.
Agents at Abnormal generate and request review for over 200 pull requests a day, and the green CI checkmarks tell us little about whether they are actually safe to merge.
Agents write code faster than people can read or understand it, and the usual response we see is to make review faster: more AI reviewers, auto-triage the findings, auto-stamp the low-risk changes. We do some of that. It doesn’t touch the reason a diff is slow to review, which is that a diff shows you what the agent typed, not whether it works. The unit tests pass and still nothing in the PR shows the change running against a real service. So, often, the reviewer pulls the branch locally to run and inspect the remaining validation. This is slow, inefficient, and worst of all a huge context-switch for the engineer.
So we changed what shows up for review. Every PR Nora (our internal harness) opens has to prove itself: a screenshot from a running instance, the real API response with the expected fields, the log line showing the record processed, the new metric incrementing on a live request path. The reviewer checks evidence against the claim instead of simulating the program in their head.
That evidence isn’t easy to generate. Producing it means every coding agent gets its own real, near-production environment with real data, hundreds of times a day. In our stack, we call these testboxes.
Define the proof, then generate it
Whether a change is well-designed still matters to us, but the PR isn’t where we settle it. Design gets decided earlier, in the “plan” phase, before any code exists. By the time a PR opens, the open question is correctness, and correctness is what evidence can answer.
Proof takes two steps: define it, then produce it. Our company-shared plan skill writes a test plan into every spec and that plan lands on the PR before any code is written. The agent then configures testboxes to run pre-existing and just-in-time integration tests that produces exactly that evidence.
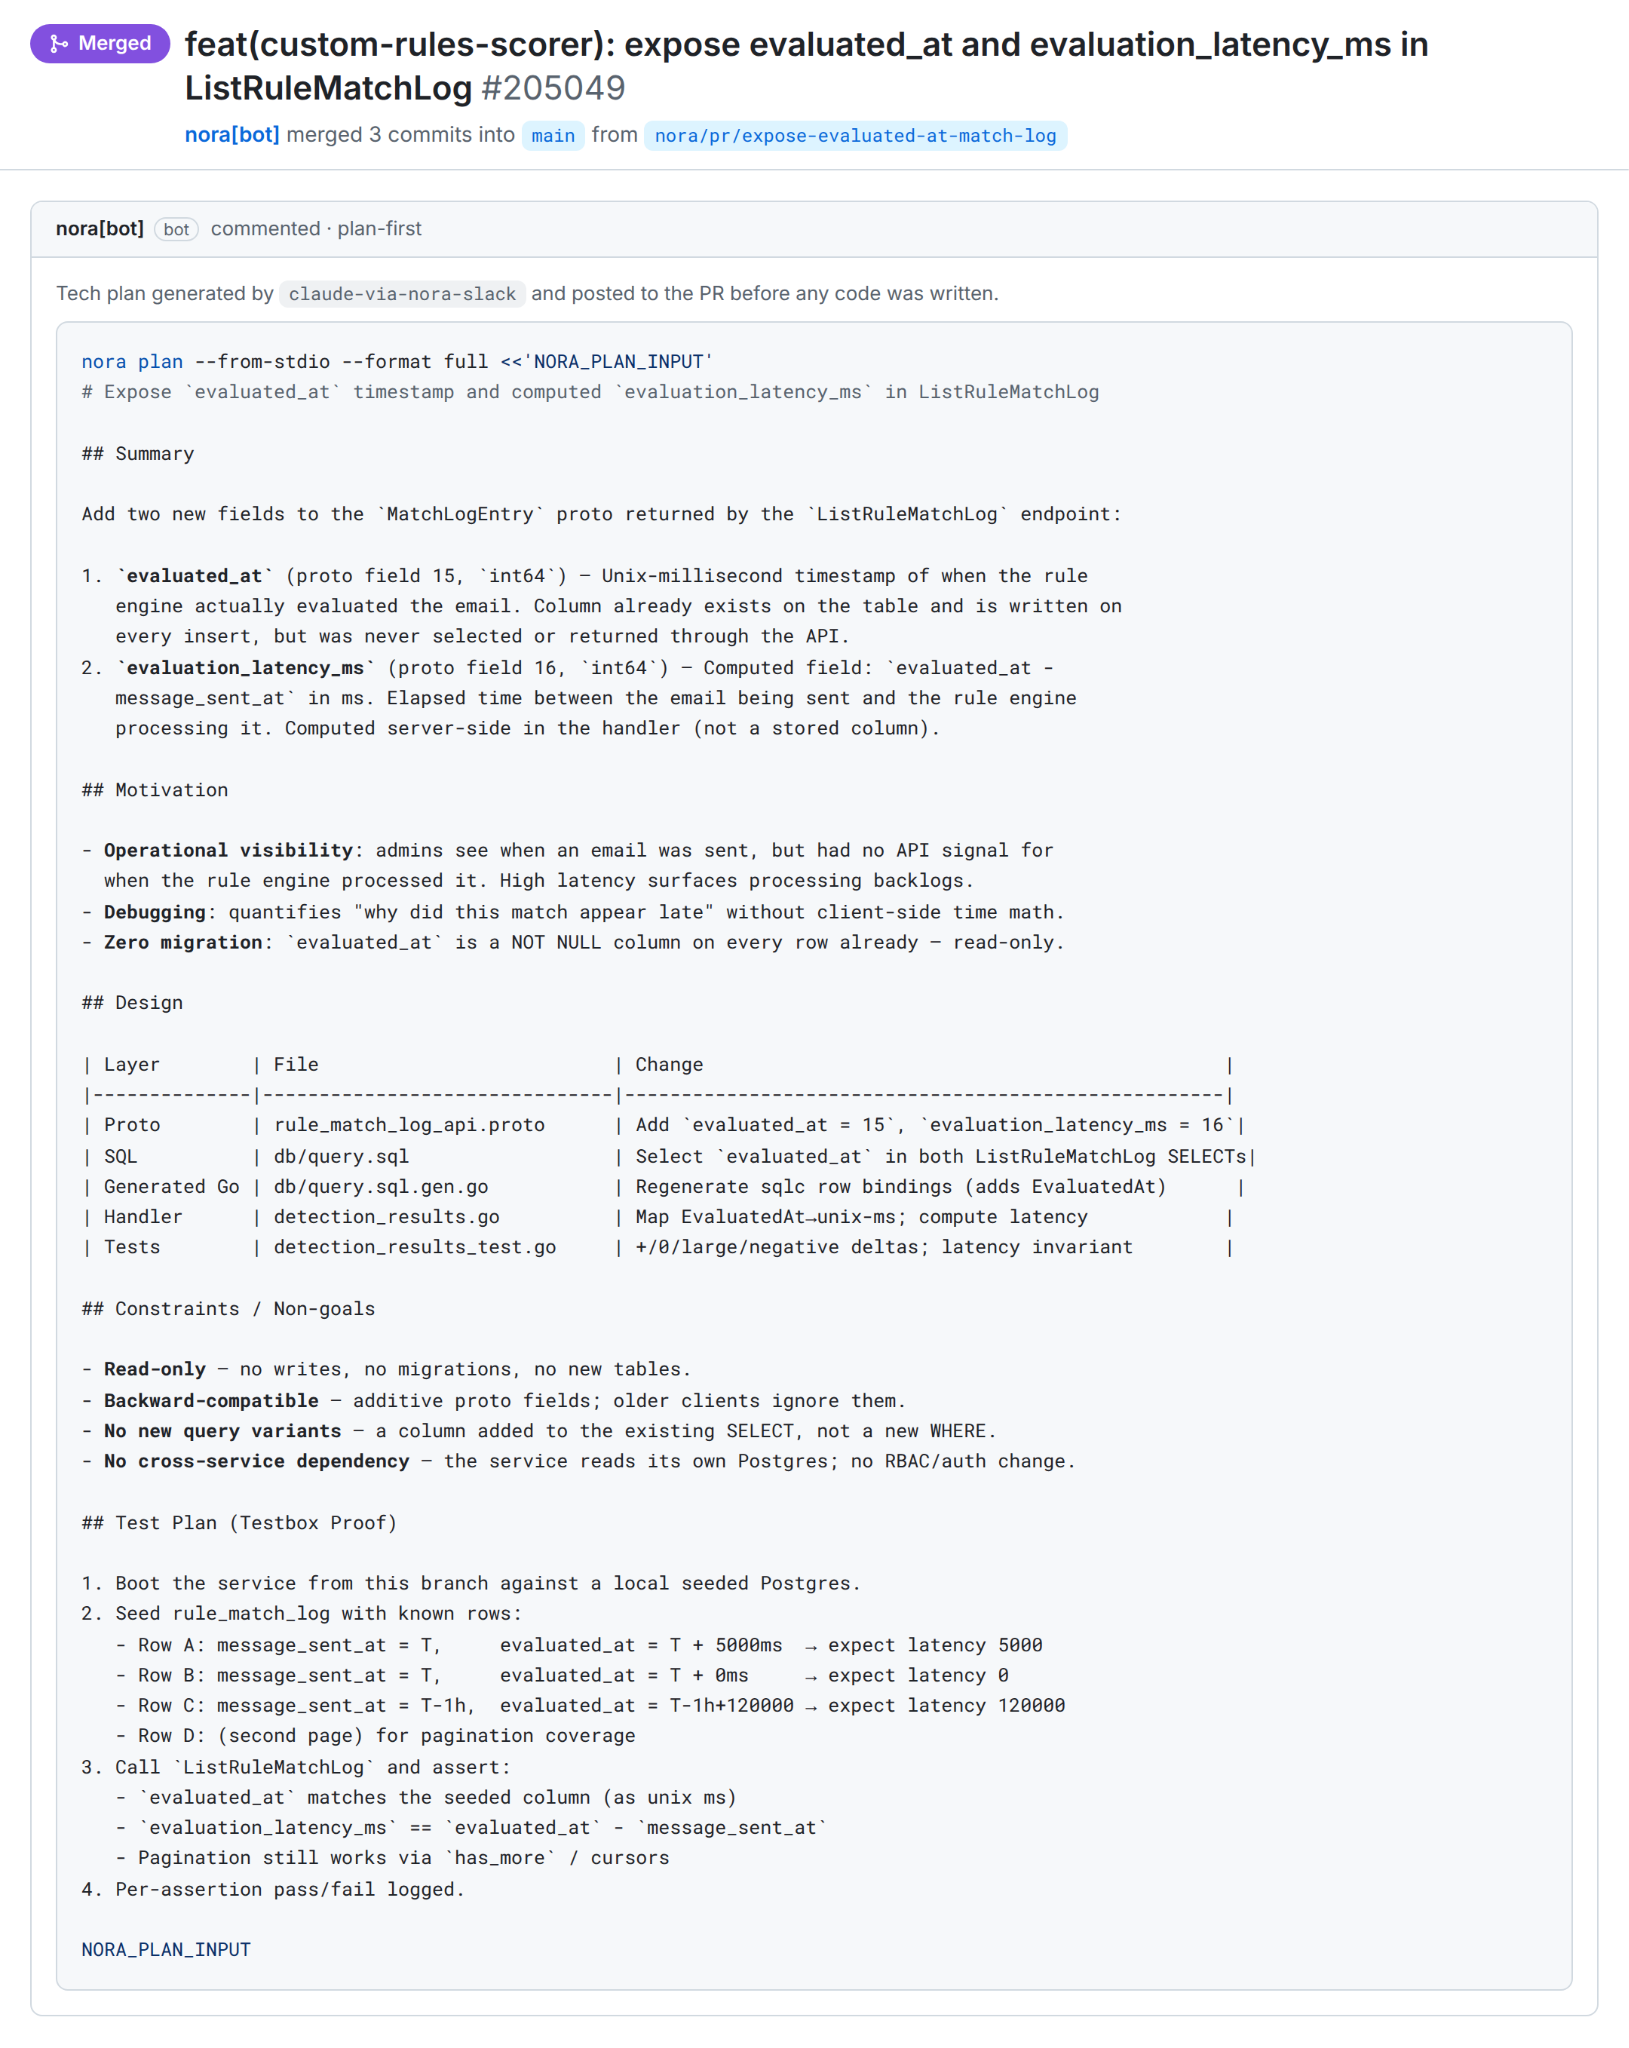
We use the following template for every plan, separating verification into three phases:
## ... Phase N ...

... code ...

### Verification

#### Devbox Checks

[Devbox = local machine or Modal sandbox (interchangeable)]
...

#### Testbox Checks

[Testbox = real AWS credentials + live infrastructure (K8s pod)]
- [ ] [API/gRPC] New/changed endpoint or RPC returns expected status + body shape, plus the auth/negative case (real request against the live service)
- [ ] [UI] Before/after screenshot of the populated and empty states (needs a rendered frontend)
- [ ] [Kafka/consumer] Seed the input topic with representative messages on a declarative cluster, run the consumer, and assert what it drives
....

#### Manual Checks

[Manual = requires human judgment. If it involves running a command, it belongs above. May be empty. Each item should briefly note why devbox+testbox are insufficient.]

....
There is no single form of proof
The right evidence depends on what changed.
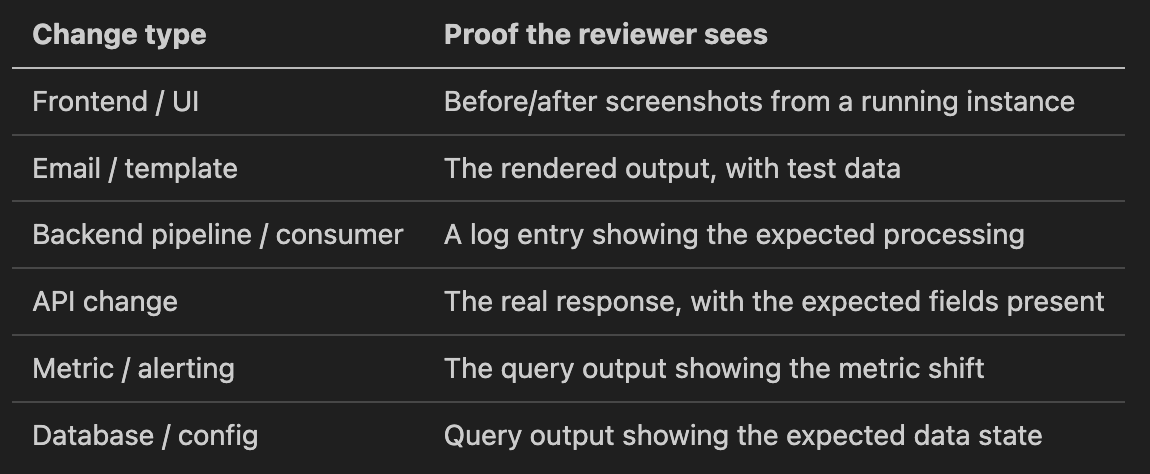
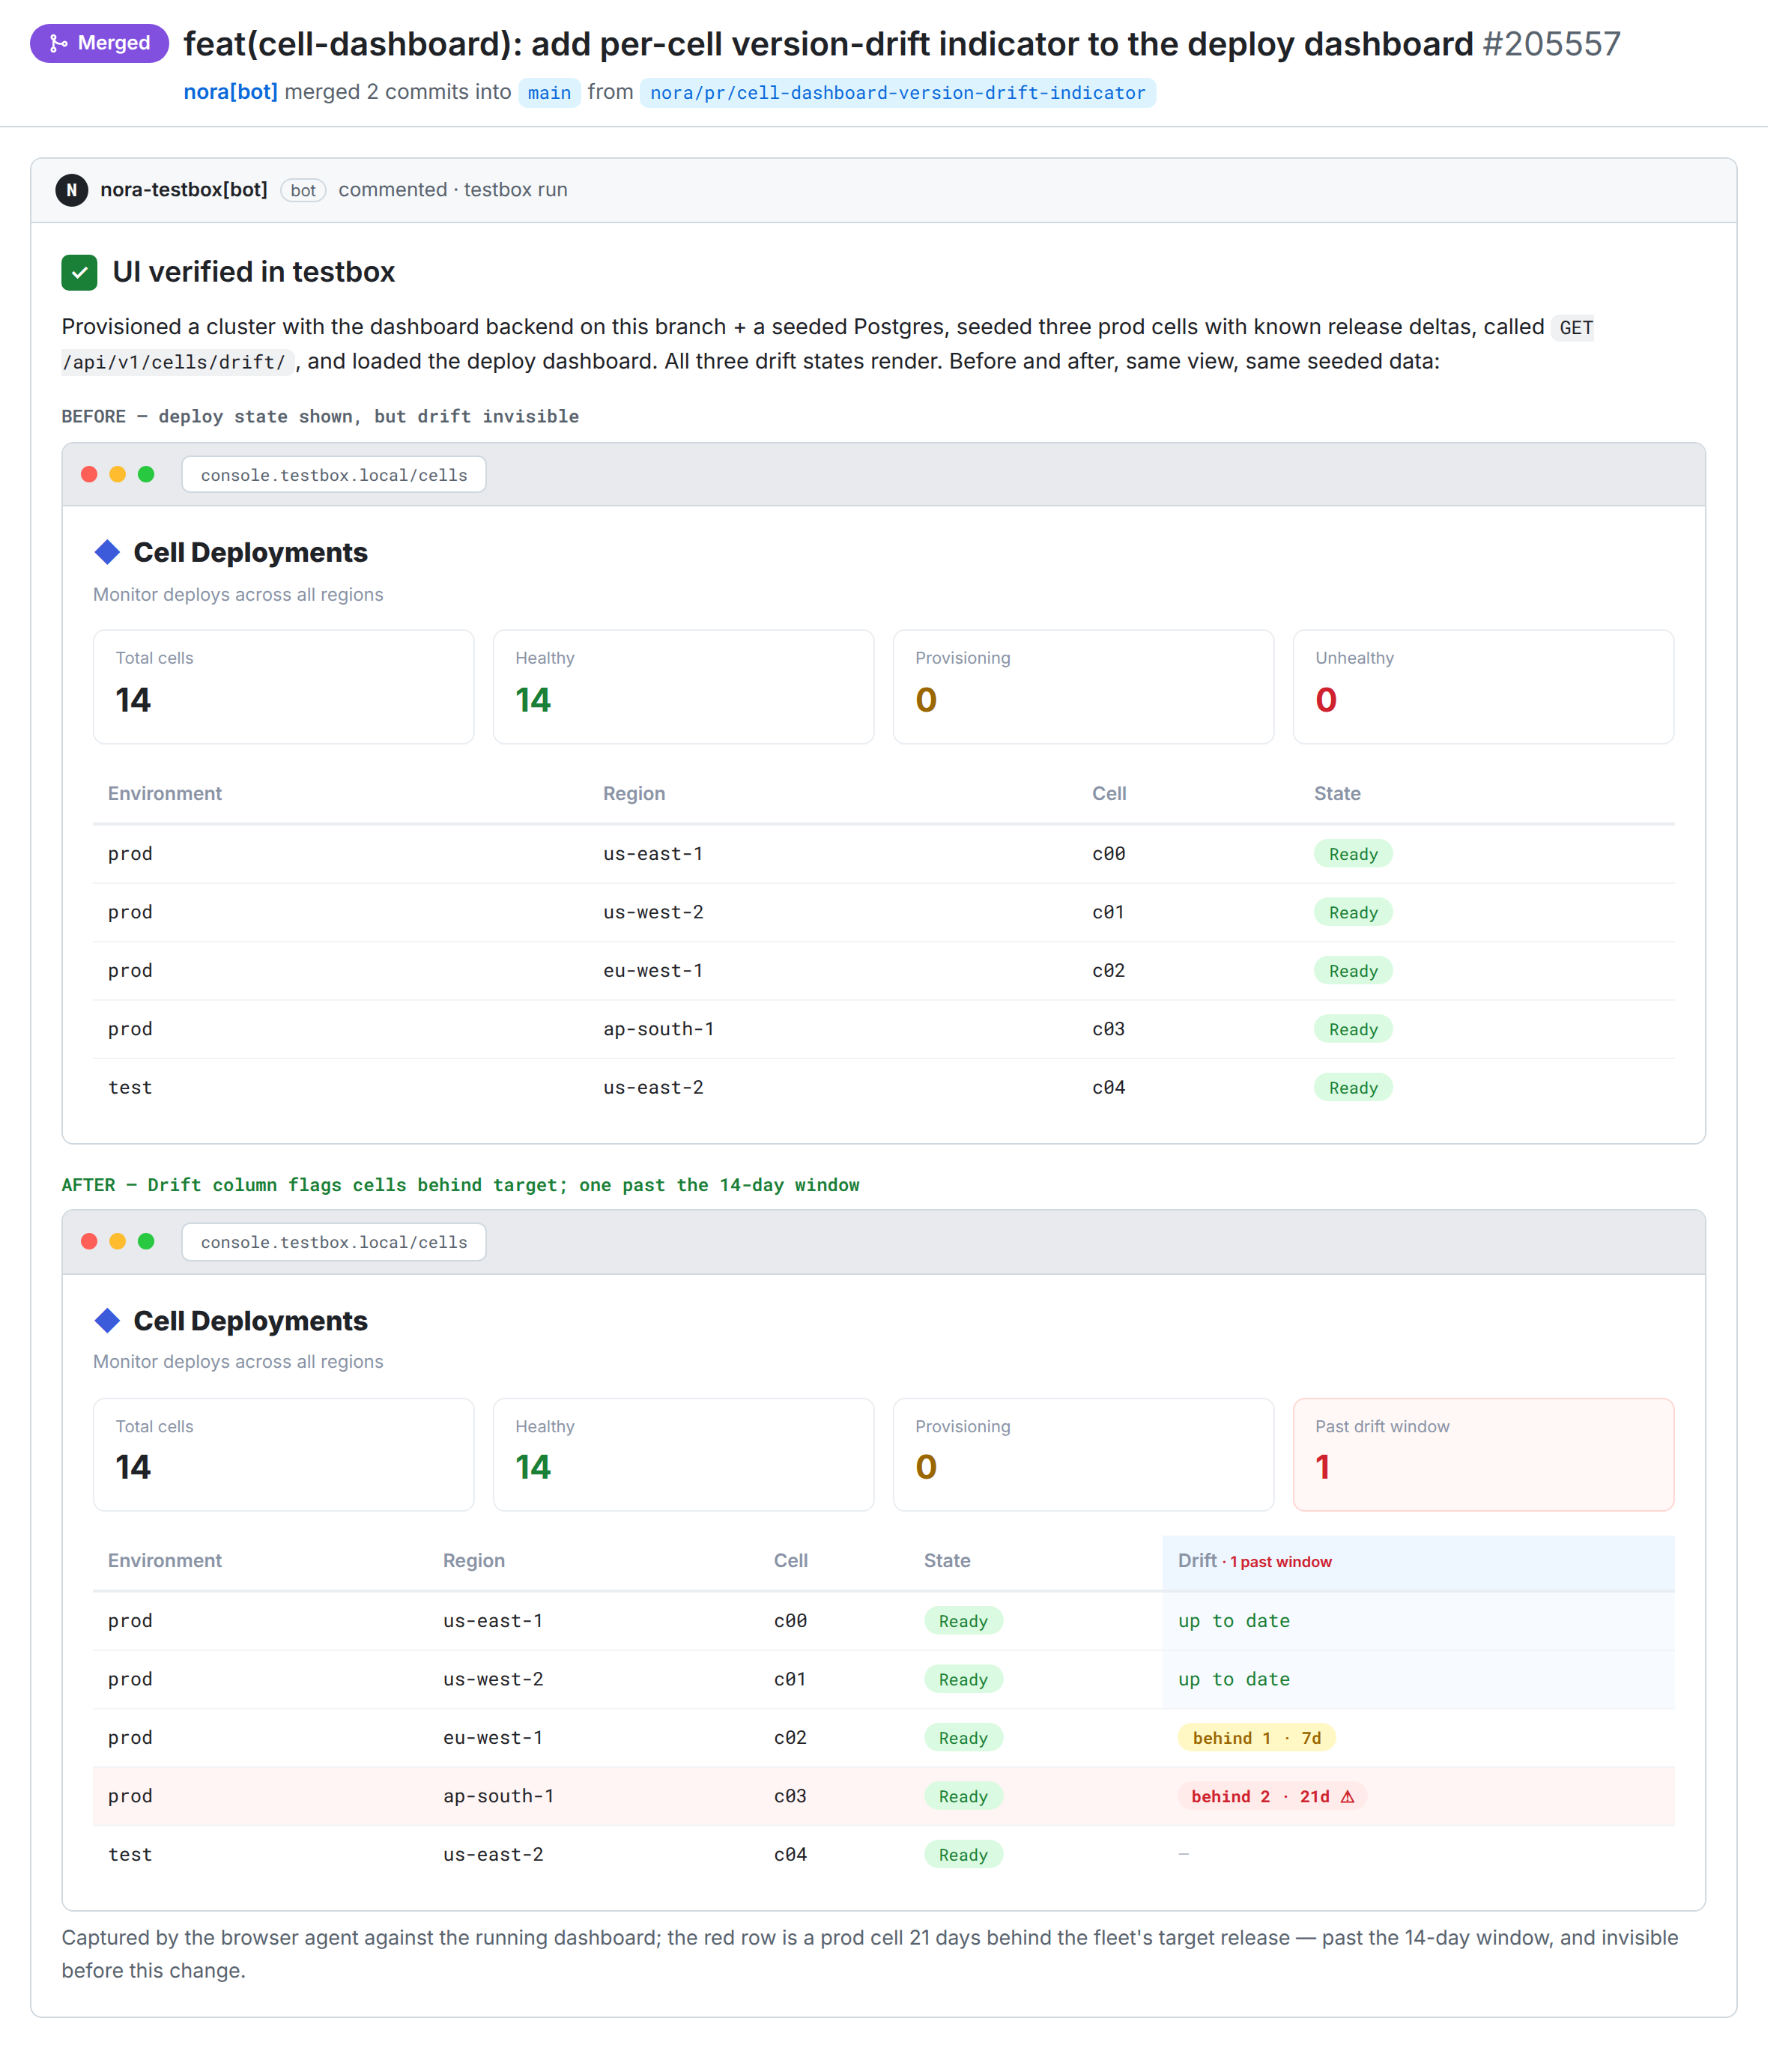
Take a UI change. An agent added a “per-cell version-drift indicator” to our deploy dashboard, a column flagging how far behind each cell is from the fleet’s target release. The browser agent brought the frontend up in a testbox against state in an isolated database and captured the before and after.
We’ve found interesting failures don’t look like binary exceptions. Early on, a UI proof came back as a screenshot of a page that returned HTTP 200 with the right title and then never mounted. Blank page, green comment, uploaded as evidence. With our latest testbox harness, the screenshot tool now reports what fraction of pixels differ from the most common color, plus a preview of the text that actually rendered.
Share one environment, override one service
The obvious version of this is a preview environment, and for a web app it mostly works. It stops working when the change is a Kafka consumer, or a metric, or a schema migration, and when you need a few hundred a day with isolated data rather than one per branch. We didn’t find something that would do that against our own service topology, so we built it.
A testbox is a real service orchestrator in near-production config, on a live endpoint, with its own private copy of every datastore it declares. What makes it work at agent scale is what we don’t do: clone the whole platform per change. Every agent shares one running base environment and overrides only the service it’s touching. Requests hit the shared services by default. The one hop you’ve changed points at your own instance. You pay for that hop and its datastores, not for a copy of the platform, which is the difference between a few hundred of these a day being routine and being unthinkable.
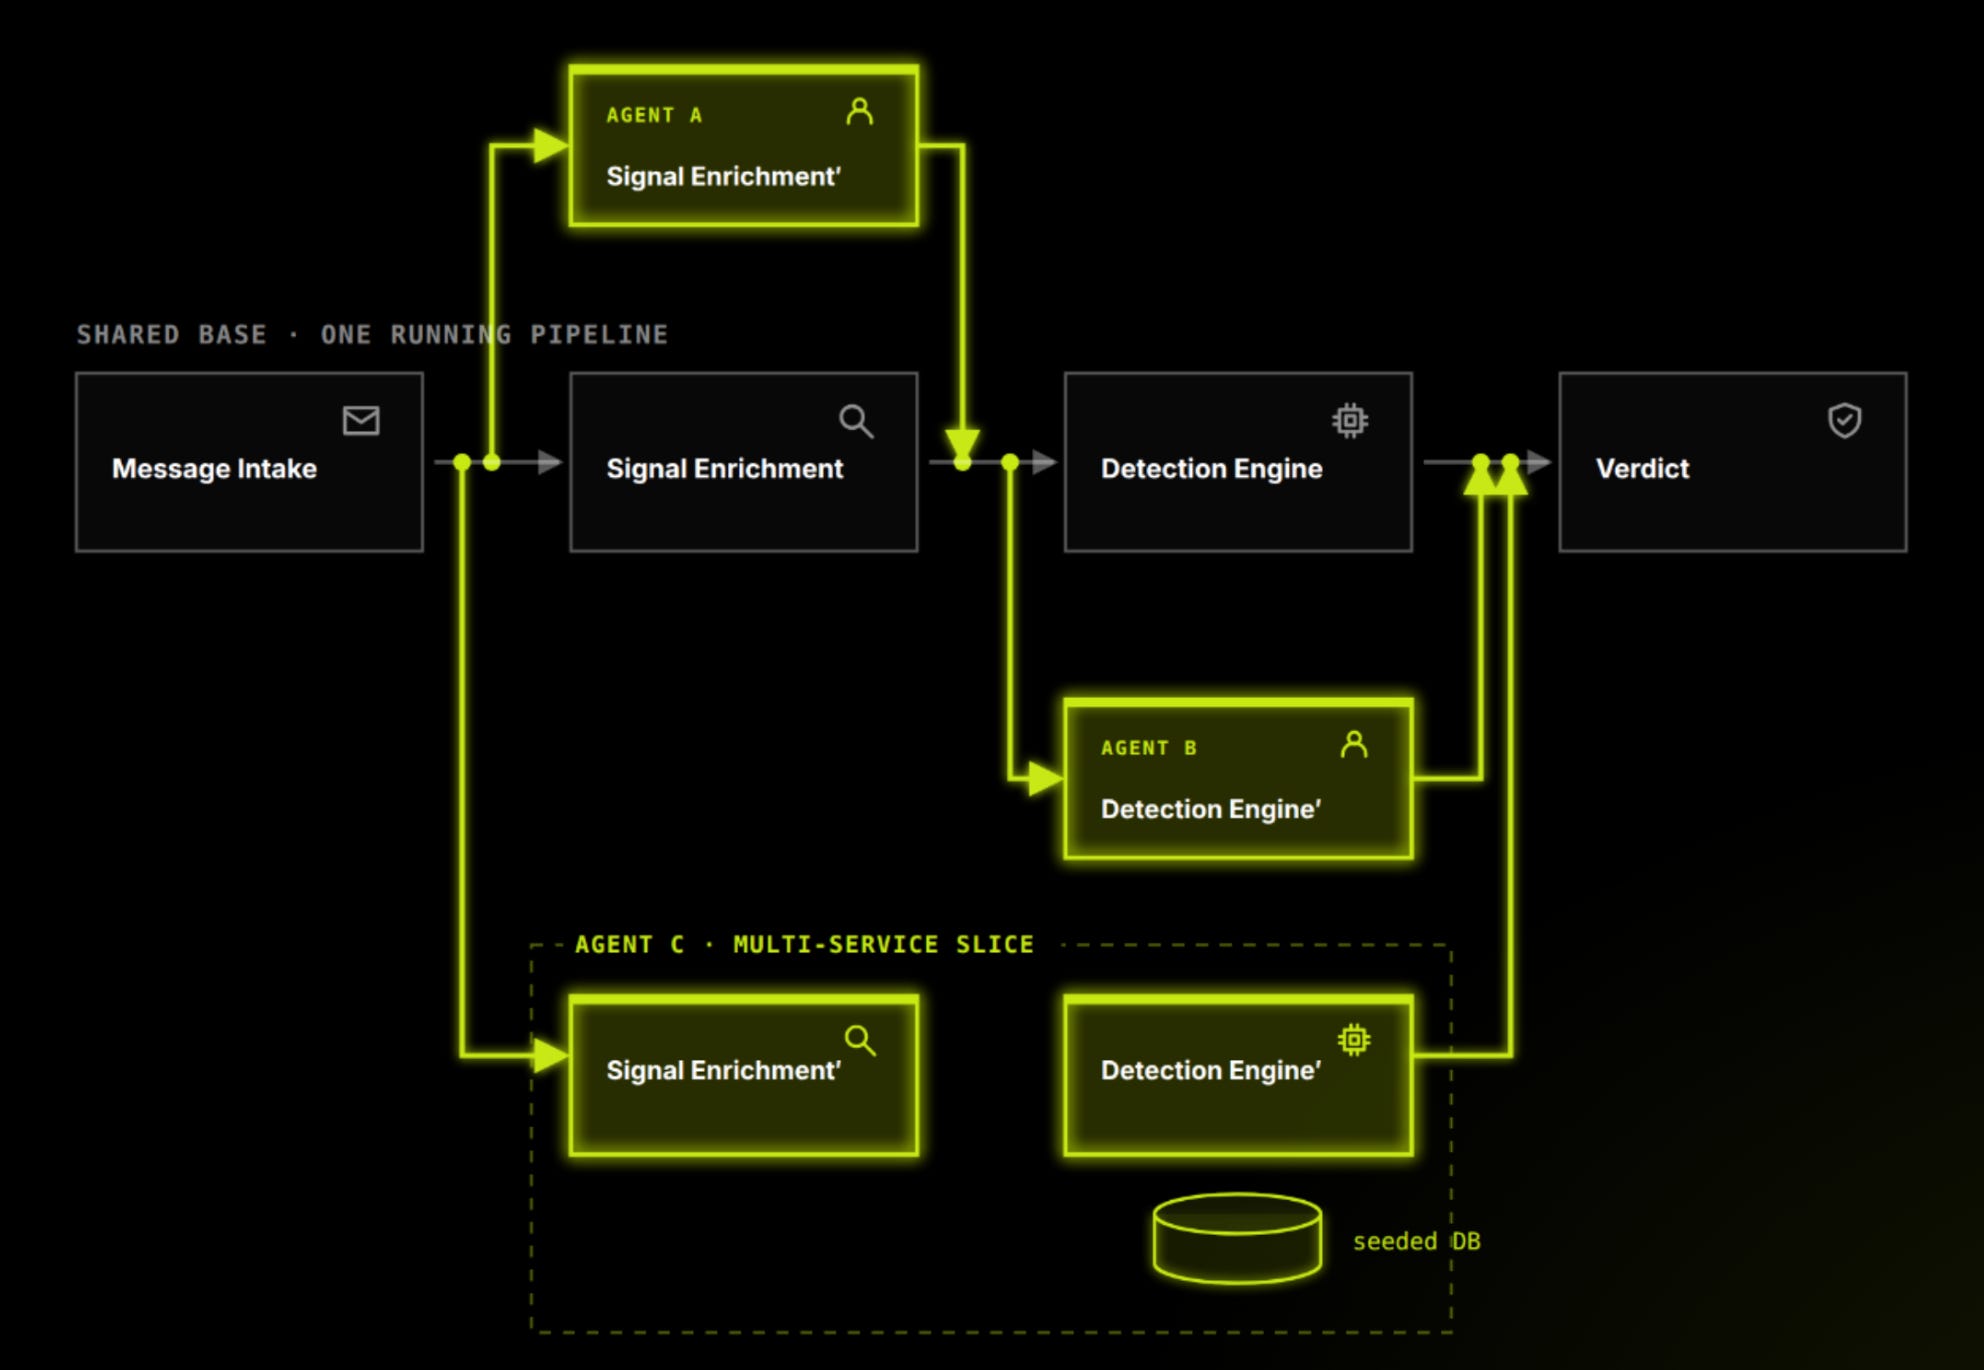
The redirect costs the service nothing, because our services already resolve dependencies through an internal alias scheme rather than hardcoded connection strings. A testbox just rewrites what those aliases point at, and the service under test runs unmodified code.
That indirection is also where it bites you. A redirect only works if every consumer of the config layer honors it, and the ones that don’t fail silently, because a working connection to the wrong database looks exactly like a working connection. We shipped two consumers that quietly ignored ours. A capture agent on each node now records what a testbox actually talked to, so we can compare that against what its manifest declared.
It composes. When a change spans services, the agent writes a short manifest naming what to build from source and what to seed. Named services find each other, and anything you didn’t name falls back to the shared test resources.
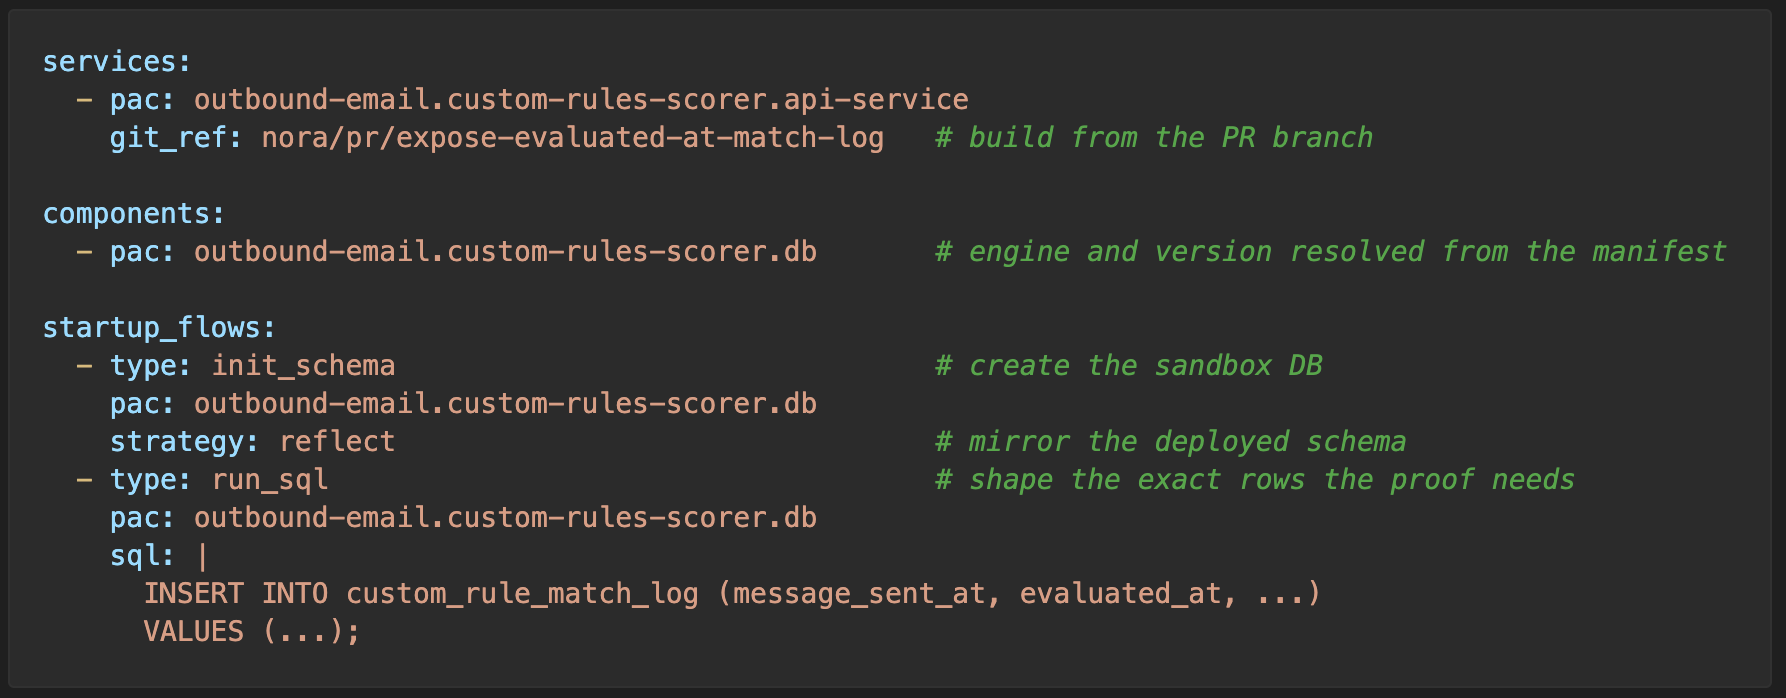
Real integration proof also needs real data. So Postgres, OpenSearch, Kafka, DynamoDB, and Redis each come up as the real engine in a container, per testbox, in seconds, at the version the deployed service runs.
What gets seeded is a per-store decision, and it isn’t always a copy. Postgres and OpenSearch clone from the deployed test instance. Kafka and DynamoDB clone nothing and generate synthetic records from a template instead, because a captured message stream is the wrong thing to leave lying around in a sandbox. For object storage it’s a keyspace, so each run gets its own prefix in the real bucket dynamically managed by the harness.
What the reviewer actually reads
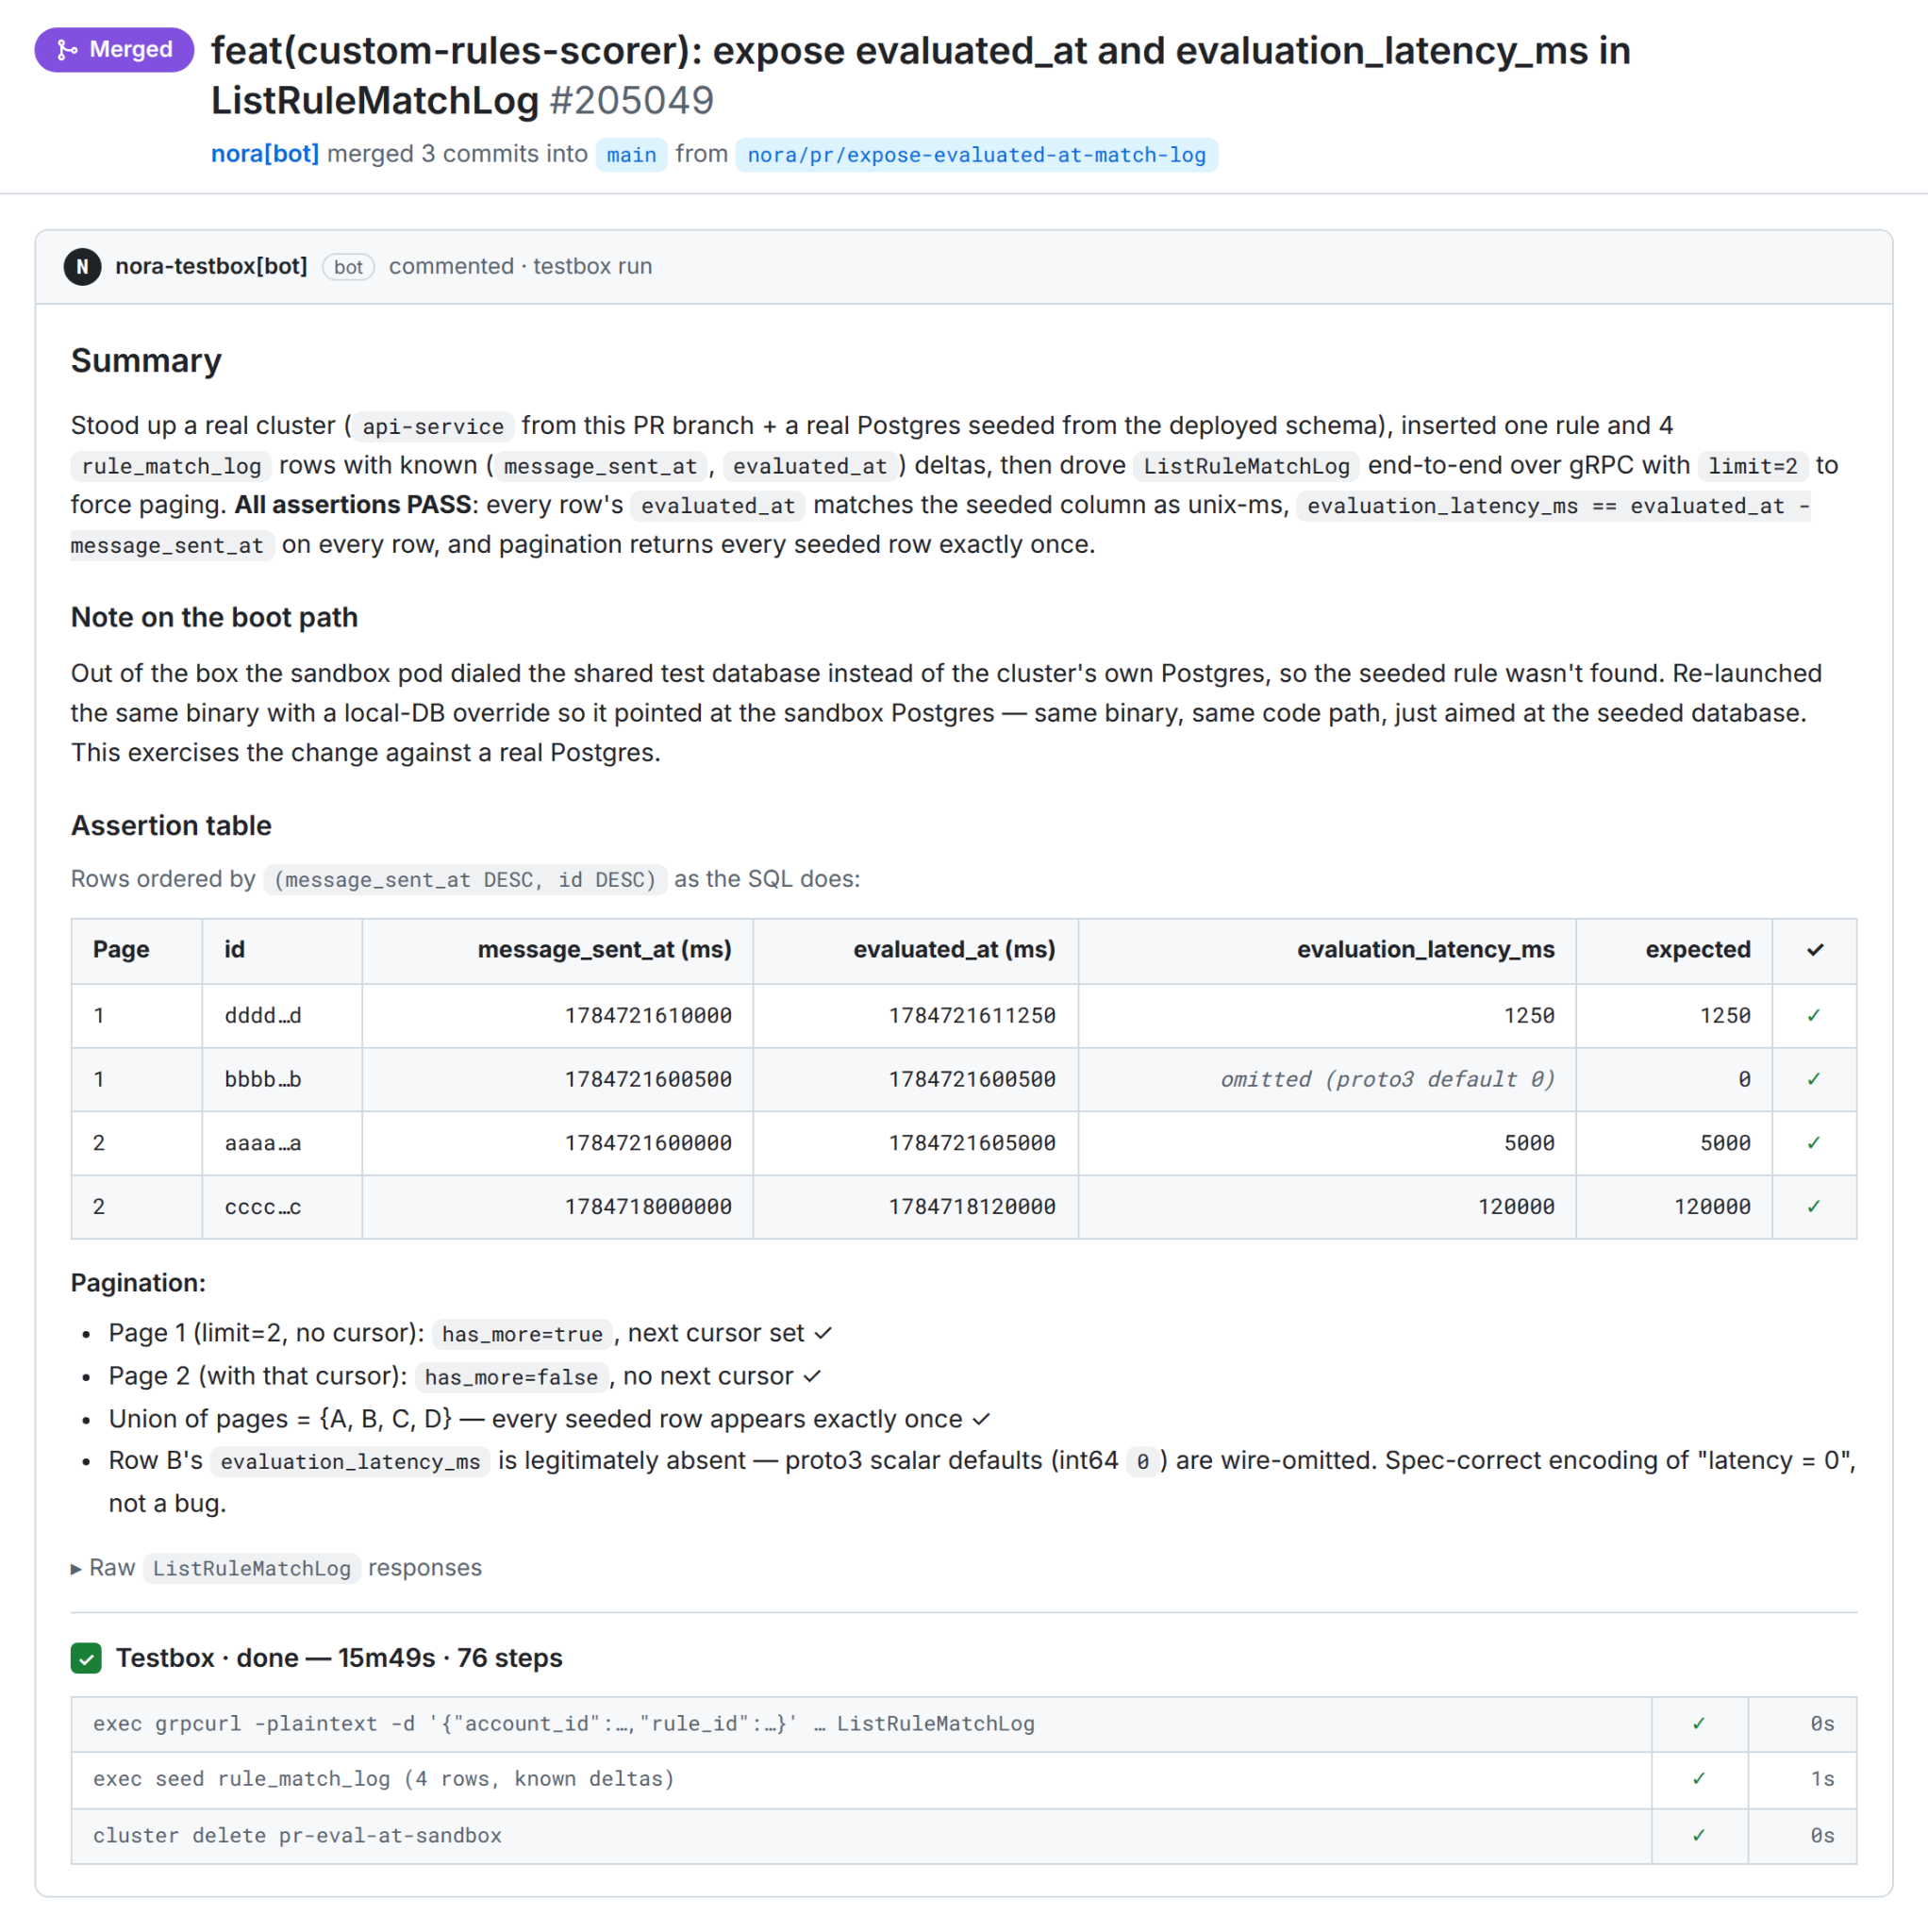
Here’s the change from that example plan. An agent picked up a small addition to a rule-match-log API: return two fields that were already in the database, the time the rule engine evaluated a message and the latency between send and evaluation.
The returned values have to match the stored data exactly, the computed latency has to be right in every case including a zero delta, and pagination has to keep working. So the agent stood up the real service on its branch against a real Postgres, seeded four rows with known timestamps, and drove the endpoint over gRPC, paging with a small page size. Every assertion held: each returned value matched its seeded row, the latency math was correct on every row, and pagination returned each row exactly once.
An agent capability, not a workflow
Nothing about this is a “stage”. There’s no required job that runs testbox checks at a fixed point in the pipeline. It’s a tool surface, and any harness holding an agent loop can pick it up.
testbox_cluster_apply(name, spec_yaml)      # declare services + datastores, seed them
testbox_start_service(pod, pac_id, service) # launch this branch’s code
testbox_service_status(pod)                 # ready | pending | crashed | completed
testbox_exec_in_pod(pod, command)           # drive it: grpcurl, psql, produce to a topic
An engineer comments /testbox on a PR and gets a run against the diff in front of them. A background agent working a ticket calls the same tools mid-loop, reads the failure, patches, and re-runs before a human ever looks. The same surface is wired into Slack, Jira, and local coding agent CLIs, so the trigger sits where the work already is.
Fast enough to live in the loop
A single-service deploy through our full CI/CD can take 20 to 30 minutes. If deploying or a human pressing a button is the only way to watch your change run against real services, that’s a huge bottleneck.
A testbox stands the same service up against a real database and its dependencies in less than 5 minutes, often faster than getting the system running on your own laptop. And because the harness persists, each successive check reuses it rather than paying the setup cost again, so the loop gets cheaper the longer the agent works.
Every miss becomes a check
Some behaviors never show up before merge. Production integration tests catch that, and testboxes shrinks how much reaches them.
When something does slip past and surface as an incident or a deploy failure, the miss becomes an input. We write it back into the testbox checks and our planning skill, so the next change of that shape gets caught before merge instead of after. Over time the gaps that only production used to catch move earlier with our test environment’s production parity iteratively and automatically improving over time.
The adoption curve is steeper than we planned for, with over 3,000 testboxes used by agents in the last 30 days, across 64 engineering teams1.
If this is how you want to work, we’re hiring.
Agent PR volume is counted from the GitHub labels our internal automations stamp on agent-opened PRs. Testbox and team counts come from testbox creation records for July 2026. Startup time is measured from cluster apply to all services launched across ~250 testbox cluster runs over the last two weeks, where p50 was 112 seconds and the mean was just under 3 minutes.
